
Project Information
- Category: Data Visualization & Analytics
- Client: Zweig Group
- Date: 2024
- Technologies: Django, Chart.js, Python, JavaScript
- Role: Full-Stack Developer
Year-Over-Year Trends
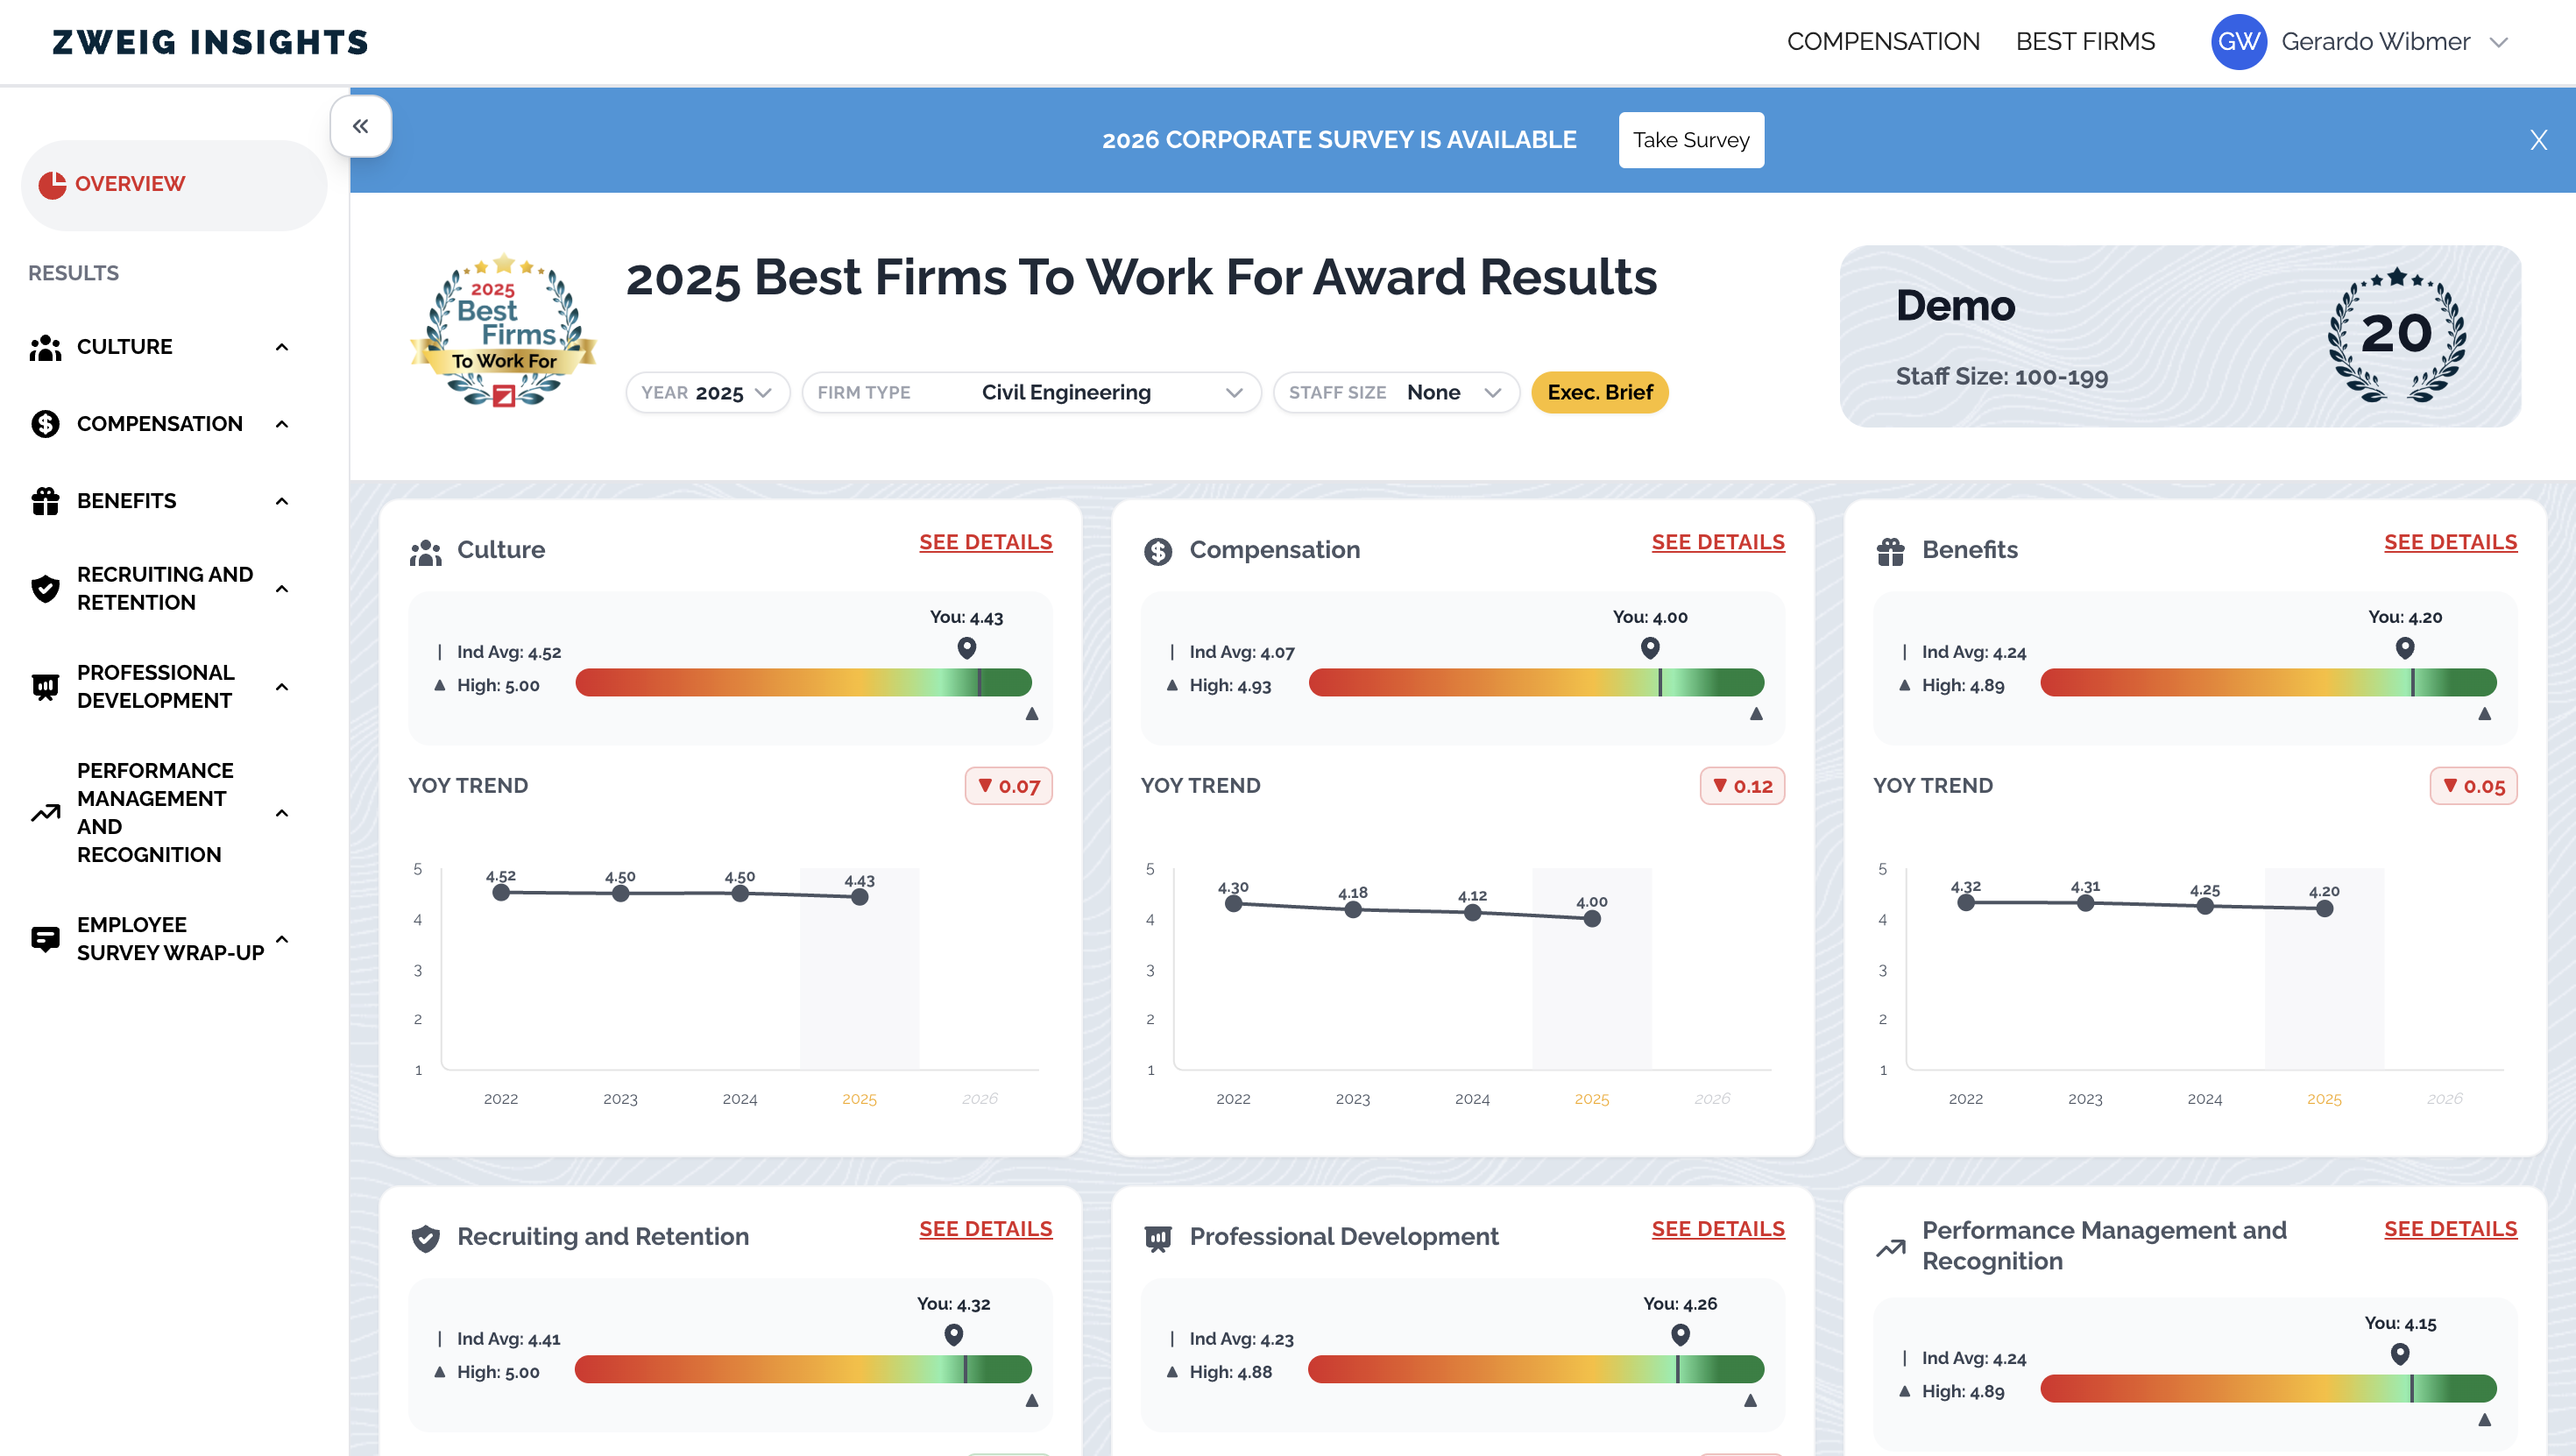
A Django-powered feature within the Best Firms to Work For survey platform that visualizes how employee sentiment has shifted across up to five consecutive survey years.
What it does
A Django-powered feature within the Best Firms to Work For survey platform that visualizes how employee sentiment has shifted across up to five consecutive survey years, enabling companies to track progress and identify patterns over time.
Key Features
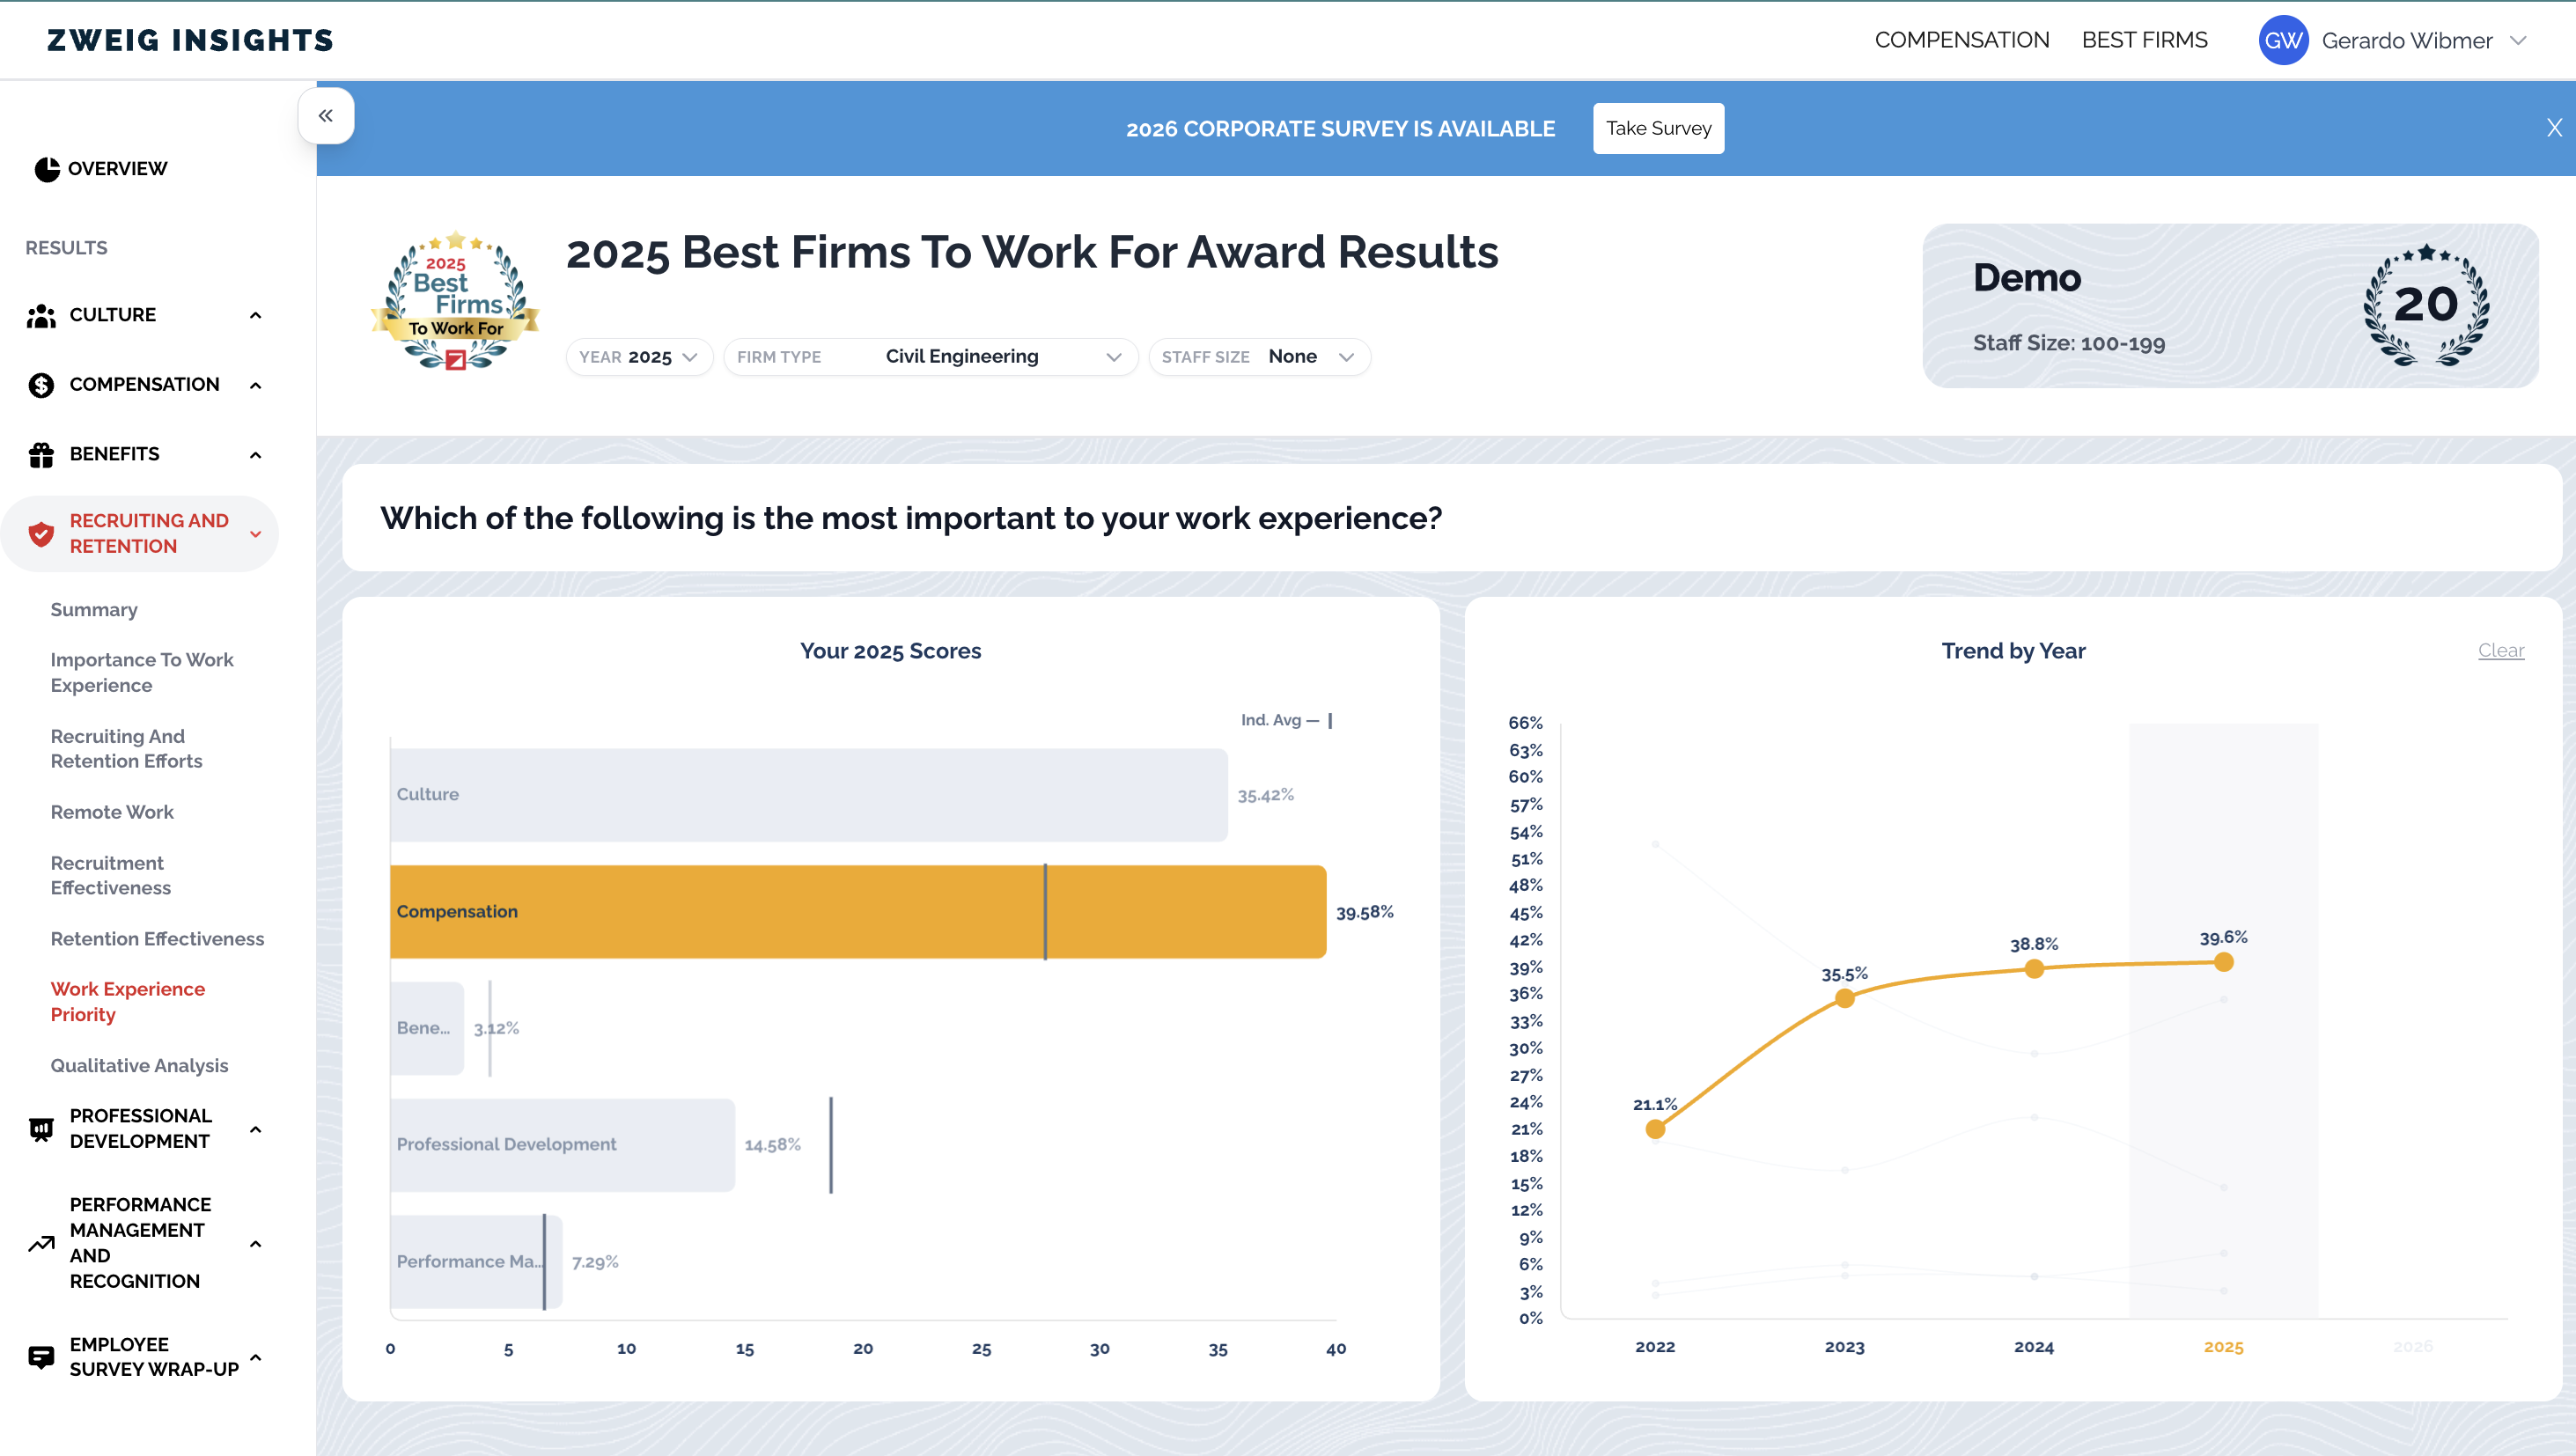
- Question-Level Trends: Multi-line charts showing how response distributions evolved year-over-year for each survey question
- Category-Level Trends: Single-line trend charts with YOY delta badges (▲/▼) indicating changes per survey category
- Smart Data Handling: Gracefully handles missing years with dashed gap segments and placeholder datasets, keeping charts readable even with incomplete history
- Interactive Filtering: Clicking a response option in the bar chart highlights its corresponding trend line, dimming all others for focused comparison
- Five-Year Cap: Automatically surfaces only the most recent five years of data to keep charts clean and relevant